

Every feed additive brochure proudly claims that “performance was significantly improved (P < 0.05).” Yet many nutritionists still wonder what statistical significance really means.
Does a significant result guarantee that a product works?
Does a non-significant result prove that it does not?
And how should we interpret numerical improvements that fail to reach statistical significance?
The answer begins with understanding that animals are biological systems. Even if we conduct a trial with two identical negative control groups receiving exactly the same diet under identical management conditions, the results will never be perfectly identical. One group may achieve a feed conversion ratio (FCR) of 1.55 while the other reaches 1.58, or one group may gain 20 g/day more than the other. Genetics, health status, feed intake, social hierarchy and many other biological factors naturally create variability between animals.
Consequently, every experiment produces differences between groups, even when no treatment is applied.
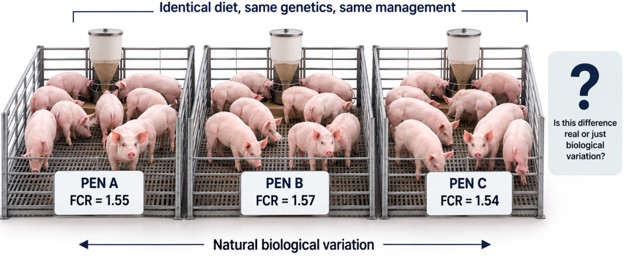
If we now introduce a third group receiving a feed additive, the important question is no longer whether its performance differs from the control, but whether the improvement is greater than the normal biological variation that naturally exists between untreated animals. Statistics were developed precisely to answer this question.
What does the P-value really mean?
First, we need to clear an important point. Never draw conclusions when comparing products over different periods. If product A is used first and product B afterwards, any improvement cannot automatically be attributed to product B. The second period may still benefit from a delayed or carry-over effect of product A, while the animals may also have developed greater immunity and resilience over time. Changes in health status, climate, feed or management add further variability. To compare efficacy and calculate a meaningful p-value, products should be tested simultaneously under comparable conditions. A before-and-after comparison is an observation, not proof that one product is better.
Every statistical comparison generates a P-value. It estimates the probability that the observed difference could simply be explained by normal biological variation.
Suppose two identical control groups produce slightly different FCR values and the statistical analysis gives a P-value of 0.62. This means there is a 62% probability that the observed difference occurred simply because of natural biological variability. We therefore conclude that the two groups are not statistically different.
Now suppose a treatment group produces a much better FCR and the calculated P-value is 0.03. There is now only a 3% probability that such an improvement resulted from natural variation alone. We therefore have 97% confidence that the feed additive contributed to the observed improvement.
The P-value does not measure the magnitude of the response, nor does it indicate the probability that the product works. It simply measures our confidence that the observed difference is real.
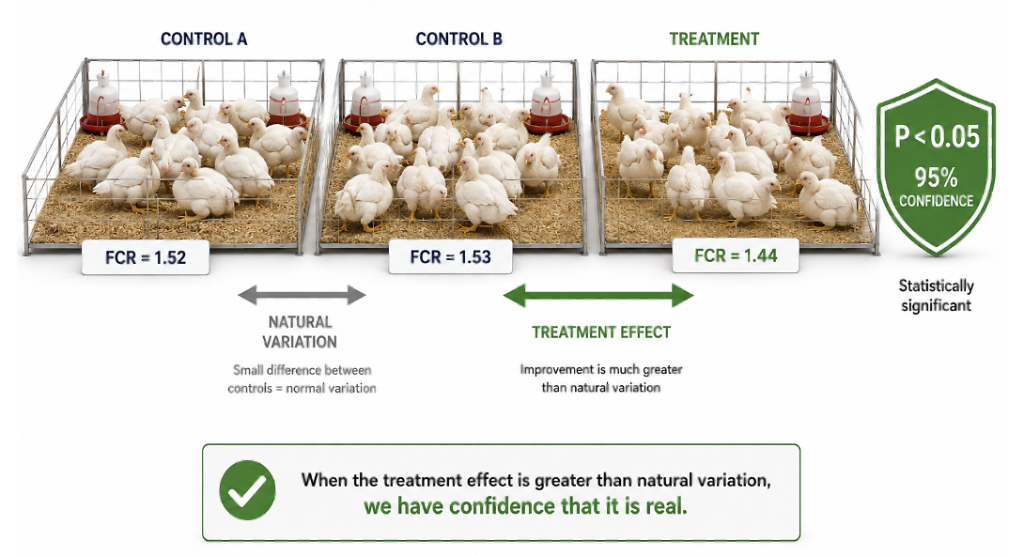
Most animal nutrition studies consider P ≤ 0.05 as statistically significant, corresponding to at least 95% confidence. Values between 0.05 and 0.10 are often described as a statistical tendency, suggesting that the treatment is likely to have an effect but that additional evidence would increase confidence. When P exceeds 0.10, results are generally considered not statistically different. Reporting the exact P-value is always more informative than simply writing “NS” (Not Significant), because a P-value of 0.12 carries considerably more evidence than a P-value of 0.85.
Statistical significance should therefore not be viewed as a simple yes-or-no decision. Confidence increases progressively as the P-value decreases.
What if there is no statistical difference?
One of the most common misconceptions is that a feed additive does not work simply because the results are not statistically significant.
Imagine that a treatment increases average daily gain from 850 to 868 g/day, but the calculated P-value is 0.12.
Should this result be ignored? Certainly not.
The absence of statistical significance simply indicates that the observed improvement is not sufficiently greater than the normal biological variability to reach the desired level of confidence.
This situation generally occurs for two reasons. First, the treatment effect may simply be relatively small compared with the natural variation between animals. Yet even a 1% improvement in feed conversion can generate an excellent economic return under commercial conditions.
Second, the trial itself may contain substantial background variability. Differences in genetics, subclinical disease, environmental conditions, feed distribution, animal handling or measurement accuracy all increase the “noise” of the experiment, making it more difficult to distinguish the true effect of the feed additive.
A numerical improvement should therefore never be dismissed simply because it is not statistically significant. It represents a biological response, but one that is associated with a lower level of confidence.
How to lower the P-value to increase confidence
When a first trial produces a high P-value, confidence can often be increased by improving the experimental protocol or by accumulating additional evidence.
The first approach is to increase the number of independent experimental units. In nutrition studies, statistical confidence depends on the number of independent measurements rather than simply the total number of animals. For example, if feed conversion ratio is measured per pen, increasing the number of pigs within each pen does not create additional observations because the pen remains the experimental unit. Increasing the number of pens, cages, batches or farms provides more independent measurements and produces a more reliable estimate of biological variability.
The second approach is to reduce biological variability between experimental units. Using animals with similar genetics, age, body weight and health status, while maintaining identical housing, feeding and management conditions, reduces background variation. Genetic homogeneity is particularly important because animals with similar genetic potential respond more uniformly to nutritional interventions. Likewise, careful control of feed distribution, animal handling and health throughout the trial minimizes unnecessary variability and increases confidence in the results.
This also explains why trials conducted in research facilities generally achieve lower P-values than trials performed on commercial farms. Research facilities are designed to minimize biological and environmental variation through standardized genetics, housing, feeding and management. Commercial farms, on the other hand, are exposed to many uncontrolled sources of variability, making statistically significant differences more difficult to obtain even when the biological response is similar.
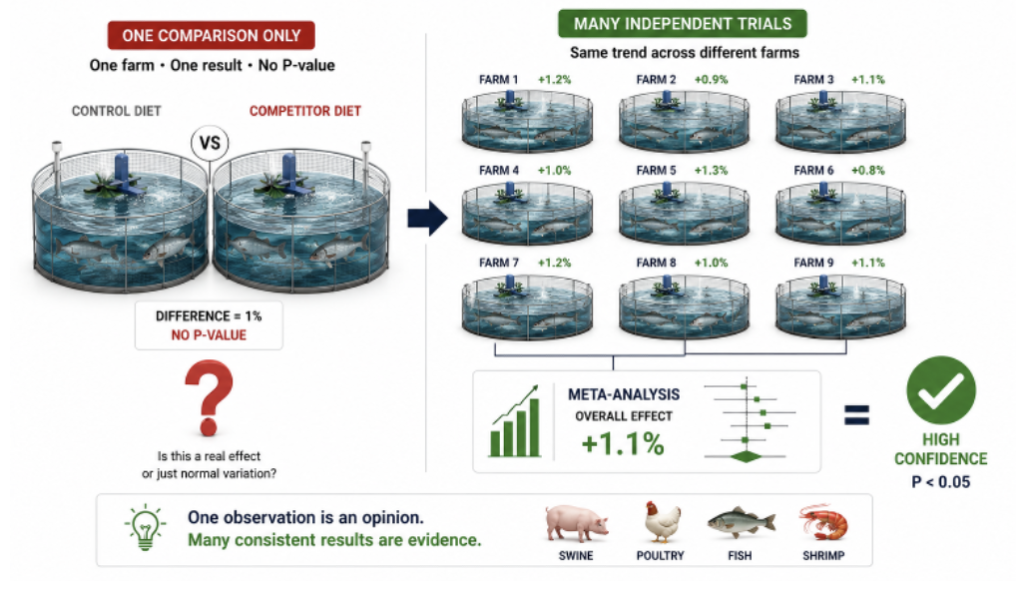
Finally, confidence can also be increased by repeating the experiment under similar conditions. If repeated trials consistently show improvements in the same direction, their results can be combined through a meta-analysis. By pooling independent observations from several farms or experiments, the overall number of measurements increases, uncertainty decreases, and the combined analysis may become statistically significant even if none of the individual trials reached P < 0.05. This is only possible when the different trials consistently demonstrate the same biological response.
Conclusion
Statistical significance is not a measure of feed additive performance but a measure of confidence in the observed results. A significant result indicates that the improvement is unlikely to be explained by normal biological variation, whereas a non-significant result simply indicates that greater uncertainty remains. It should never be interpreted as proof that a product is ineffective.
Perhaps more importantly, the P-value is often a reflection of the quality of the experimental protocol as much as the performance of the feed additive itself. Unexpected sources of variability, such as subclinical disease, environmental disturbances, inconsistent feed distribution, differences in animal handling, measurement errors or excessive biological variation, all increase the P-value by masking the true treatment effect. Conversely, well-controlled experiments with homogeneous animals and standardized management naturally produce greater statistical confidence.
When evaluating feed additives, nutritionists should therefore avoid basing their decisions on a single farm trial showing only numerical differences. Without calculating the P-value, it is impossible to know whether the observed difference reflects a true treatment effect or simply normal biological variation. A single comparison, even if it appears favorable to one product, should never be considered conclusive.
Instead, nutritionists should evaluate the overall body of evidence. Suppliers able to present numerous independent trials, conducted under different conditions and consistently showing numerical improvements, provide much stronger scientific evidence than a single on-farm comparison without statistical analysis. Even if some individual trials are not statistically significant, their consistency across many experiments—and, when available, their confirmation through meta-analysis—greatly increases confidence that the observed response is real.
In animal nutrition, one trial can sometimes be misleading, but many consistent trials tell a story. The best technical decisions are therefore based not on one isolated result, but on the accumulation of reliable evidence generated through multiple well-designed experiments.
David Serene